Zenith Gas
Case exhibits
4 exhibits for this case
ZenithGas-exhibit-1
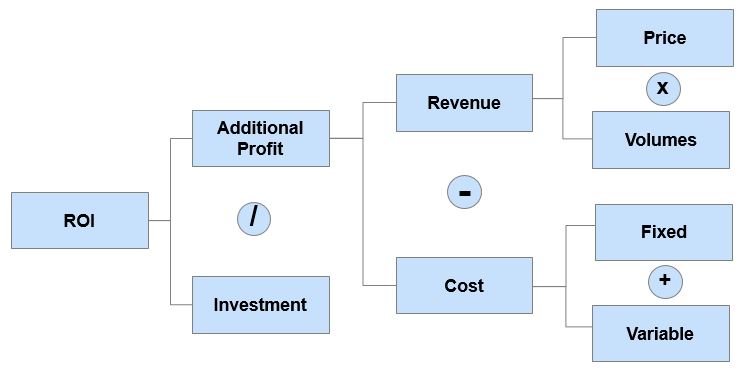
Suggested case structure
Key question: Should Zenith Gas enter the retail market for LNG filling stations?
Exhibit 1
- Profitability: estimate additional profit for the client with the market entry compared to the as-is scenario
- Revenues: estimate the size of the market and how much volume the client can expect to sell; identify the right price point based on similar products in the market
- Costs: understand the additional fixed and variable costs required
- Investment: consider all costs to be incurred for developing LNG filling stations
1. Size of Market
Total market size in revenues = # of Vehicles * Tank size in gallons * Fill frequency * Price per gallon
Exhibit 2
Exhibit 3
Number of vehicles in 2020 = 120% of 100M = 120M
Number of vehicles with LNG = 10% of 120M = 12M
Annual revenue of each segment:
- Commercial Trucks: 25% of 12M * 100 gallons * 3 fills / week * 52 weeks * $2 = $93.6 B
- Privately Owned Vehicles: 60% of 12M * 20 gallons * 2 fills / week * 52 weeks * $2 = $29.9 B
- Farm Use: 10% of 12M * 30 gallons * 1 fills / week * 52 weeks * $2 = $3.7 B
Total Annual Revenue = 93.6 + 29.9 + 3.74 = $127 B (~$130 B)
Key insight:
- An attractive market by 2020 and with increasing government support
- However, Profits & Break-even period needs to be considered before making any decision
2. Profits & Payback
Payback period / Break-even Period = Initial Investment / (Revenue – Operating Costs)
Exhibit 4
Calculations:
- Revenue per year = 20% of $130B = $26 B
- Net profit per year = 10% of $26 B = $2.6 B
- Payback period = 15 / 2.6 = ~5.75 years
Key insight:
- Client objective of having payback period of 5 years is NOT met
A strong interviewee should proactively discuss ways to reduce payback period even without prompting
Look for interviewee breaking payback period improvement into logical steps and then generate ideas into each bucket. Check here for business judgement & creativity
- Increasing revenue
- Decreasing operating cost & initial investment
1. Increasing revenue (illustrative)
- Increase price of fuel
- Sell more goods (convenience stores)
- Sell other fuels
- Allied services – e.g. carwashes
- Sign volume deals with business to increase market share
- Change location mix for stations to better target
2. Decreasing cost (illustrative)
- Partner with existing stations to reduce investment
- Franchise the format to distribute investment burden
- Lease land instead of purchase
3. Final recommendation
Zenith Gas should enter the market for retail LNG filling stations
- Attractive market – growth & large ($130 B)
- Increasing government support
- Zenith has capability to serve this need
However, since the payback period is higher than the 5-years target (5.75 years), Zenith must make strong steps to minimize costs of both investment & operation
Possible risks:
- Drastic decreases in cost of substitutes
- Disruptive technology