Wealth Management network set-up
Case exhibits
3 exhibits for this case
WealthManagement-exhibit-1
Suggested case structure
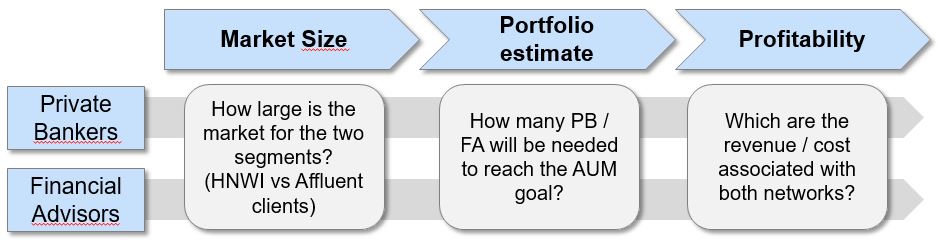
Exhibit 1
- Market Size: Estimate the market size for each segment and relate the AUM target in term of required market share. Is it the target feasible?
- Portfolio Estimate: Identify the size of the average portfolio for both PB and FA and thus calculate the required number of PB / FA
- Profitability
- Revenue stream: calculate for both segments the revenue streams (assuming a given fee structure)
- Cost base: calculate the costs associated with each network choice (fixed vs variable costs)
1. Market Size
The interviewee is encouraged to estimate the market size on her own.
If needed the following data can be shared
Exhibit 2
The total AUM available on the market is:
𝐴𝑈𝑀=𝑃𝑜𝑝𝑢𝑙𝑎𝑡𝑖𝑜𝑛 ×% 𝑤𝑖𝑡ℎ 𝑎 𝑔𝑖𝑣𝑒𝑛 𝑤𝑒𝑎𝑙𝑡ℎ × 𝑤𝑖𝑡ℎ 𝑎𝑣𝑒𝑟𝑎𝑔𝑒 𝑤𝑒𝑎𝑙𝑡ℎ
In order to estimate the market potential for Private Bankers and Financial Advisors we need to distinguish between the two different segments.
For the affluent segment we estimate the average wealth of the segment as the average between the lower bound (€200K) and the upper bound €1M, namely €600K = average (€200k, €1M). Obviously we should keep the top 1% of the population outside of the equation, as they belong to the HNWI segment.
AUM Affluent segment = 40 M × (10% - 1%) × average (€200k, €1M)* = €2,160Bn
Since we don’t have an upper bound for the top 1% of the population we assume the same ratio to the lower bound as per the Affluent segment , i.e. €3M = €1M × €600K / €200K: the actual average value may be higher because of wealth concentration, however for the purpose of this case it is important just to recognize that the average wealth of the HNWI is larger than the lower bound
AUM HNWI segment = 40 M × 1% × €3M = €1,200Bn
Key business insight
- The market size looks large enough to continue the analysis: €12Bn of AUM seems definitely a small amount of total market regardless from the current level of competition.
- The market for Financial Advisors is bigger nearly twice the market for Private Bankers
2. Portfolio size estimate
The candidate should estimate the size of the average portfolio managed by each Private Banker and Financial Advisor as:
𝐴𝑣𝑒𝑟𝑎𝑔𝑒 𝑃𝑜𝑟𝑡𝑓𝑜𝑙𝑖𝑜 𝐴𝑈𝑀=𝑁𝑢𝑚𝑏𝑒𝑟 𝑜𝑓 𝑐𝑙𝑖𝑒𝑛𝑡𝑠×𝐴𝑣𝑒𝑟𝑎𝑔𝑒 𝐴𝑈𝑀 𝑝𝑒𝑟 𝑐𝑙𝑖𝑒𝑛𝑡
From the previous point we already know the average AUM per client segment:
- Affluent Clients -> Avg AUM = €600K
- HNWI Clients -> Avg AUM = €3M
Candidate is encouraged to estimate by its own the number of clients that can be managed by Private Bankers vs Financial Advisors, if asked respond that:
- Average number of clients for Private Bankers = 20 (rationale -> each client would require 1 full day of work per day)
- Average number of clients for Financial Advisors = 40 (rationale -> each client would require half day of work per day)
Thus:
- Average AUM for Private Bankers = 20 × €3M = €60M
- Average AUM for Financial Advisors = 40 × €600K = €24M
Thus, in order to achieve the goal of AUM = €12Bn, we will need either:
- 200 Private Bankers = €12Bn / €60M
- 500 Financial Advisors = €12Bn / €24M
3. Segment profitability
In particular the interviewee need to identify a high level framework to estimate the profitability of each channel, pinpointing:
- Revenue stream for the bank (how the bank generate revenue from the AUM?)
- Fixed cost (which are the main fixed cost for each channel?)
- Variable cost (which kind of variable cost do we expect?)
Read the following text to the interviewee and share the table of the next slide
Private Bankers
- Private Bankers earn a base salary of €80K
- Private Banking clients pay an administration fee of 1% of their AUM, of which:
- 0.75% is retained by the bank
- 0.25% is given to the Private Banker
- If the returns of the client’s portfolio exceed a given threshold the bank earns an extra 0.5% of the AUM as performance fee, out of which:
- 0.20% is retained by the bank
- 0.30% is given to the Private Banker
- We can assume this performance fee is earned in 50% of the cases
Financial Advisors
- Financial Advisors act as selling agents, as such they don’t earn any fixed salary
- Affluent clients pay an administration fee of 1% of their AUM, of which:
- 0.50% is retained by the bank
- 0.50% is given as compensation to the Financial Advisors
- Also in this case a performance fee is earned with the same structure as for Private Bankers
- In both case the variable cost associated to the asset management is 0.1%
Exhibit 3
Private Bankers:
- Revenue
- Management Fee = €12Bn × 0.75% = €90M
- Performance Fee = €12Bn × 0.2% × 50% probability = €12M
- Cost
- Fixed cost of Private Bankers salary = €80K × 200 Private Bankers = €16M
- Variable cost due to asset management = €12Bn × 0.1% = €12M
- Profit = €74M = 90 + 12 – 16 - 12
Financial Advisors:
- Revenue
- Management Fee = €12Bn × 0.50% = €60M
- Performance Fee = €12Bn × 0.2% × 50% probability = €12M
- Cost
- No Fixed cost for Financial Advisors salary
- Variable cost due to asset management = €12Bn × 0.1% = €12M
- Profit = €60M = 60 + 12 – 12
Key insight
- Private Bankers provide higher profitability but present a fixed cost
- Financial Advisors on the other hand look less profitable but require only variable cost
4. Conclusions
The case does not lead to a clear one-way solution, both Private Bankers and Financial Advisors are a viable solution. The candidate is expected to recognize this and to highlight pros and cons of each channel.
In particular given the high complementarity of the two channels the best solution is indeed a blended one (i.e. half Private Bankers and half Financial Advisors)
Private Bankers
- Pros:
- Higher profitability
- Smaller number of clients and agents required to reach the target compared to Affluent segment
- Develop relationship with High Net Worth customer may be critical for other activities of the bank (e.g. cross selling of lending products to entrepreneurs)
- Private Bankers are employees of the bank, thus leading to higher retention rate compared to independent agents
- Cons:
- Fixed cost associated to the Private Bankers salary, if the AUM target is not reached the profitability can be significantly reduced!
- Smaller market compared to Affluent segment -> the bank would need nearly twice the market share on Affluent to reach the AUM goal on Private clients
Financial Advisors
- Pros:
- Only variable cost, thus in case of smaller level of AUM obtained no extra cost is due
- Affluent segment is a larger market compared to HNWI -> the bank would need around half the market share on Affluent to reach the AUM goal
- Cons:
- Lower profitability
- Larger number of clients and agents required to reach the target compared to Private segment
Next steps
The candidate is encouraged to conclude the case suggesting the next steps for the case, e.g.:
- Verify the availability of Private Bankers and Financial Advisors: considering that we need to hire them we need to verify availability on the market of such professionals and the hiring cost (e.g. head hunting fee)
- Engage the Wealth Management department to prepare suitable products to be sold to clients
- Design an adequate organizational structure for the network and the appropriate geographical distribution